Step 1 of 10: Lube assessment & Benchmark

LUBE ASSESSMENT & BENCHMARK
PRIMARY RISK
Confidence without evidence
GOVERNS
Baseline scoring for all 9 other
steps
FEEDS INTO
Step 2 (Organisation &
Planning)
LUBRICATION RELIABILITY™ - FOUNDATION STEP
Sample output
You cannot improve
what you don't measure.
what you don't measure.
A Lube Assessment & Benchmark establishes exactly where your plant stands today - with a transparent scoring method, hands-on verification, and a maturity score you can defend to your management team, not just a checklist with a grade attached.
METHODOLOGY
The Snapshot Assessment starts with your own 1–10 self-rating on each of the eight categories below. The full on-site benchmark then verifies that self-rating against physical evidence, so the final score reflects what's actually on the floor.
How the score is built

Snapshot self-assessment
Your team rates each of the eight categories 1–10 based on current practice. This gives an initial, self-reported score and flags where perception may run ahead of — or behind — reality.
15 minutes, completed online
Site walk & physical verification
On the full on-site track, the storage area, dispensing mechanisms, MSDS postings, and colour-coding are physically checked against what was self-rated in Step 1.
On-site · scoped to plant size
Cleanliness & RCFA record review
ISO 4406 targets, Oil Analysis records, and bearing failure/RCFA documentation are reviewed to confirm whether Questions 3 and 7 reflect a real, running program.
Documentation & CMMS review
Staff interviews
Short conversations with lubrication staff and management confirm training level, how schedules are actually managed, and whether the "strategic priority" question matches daily reality.
30–45 min per role
Final scoring
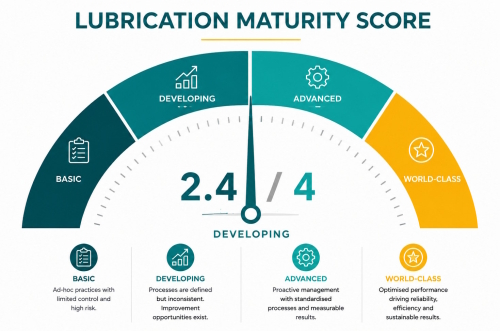
Each category is confirmed or adjusted from the self-rating based on what was found, then averaged into the overall Snapshot Score shown in the sample gauge.
Scoring shared with clientSCOPE
Eight categories, self-scored 1–10
These are the exact eight questions your team rates today, each on a 1–10 scale. Together they produce your overall Snapshot Score - the starting point for the full benchmark.
1 Strategy
Lubrication Strategy
Dedicated staff perform lubrication, and management treats it as a strategic part of the Reliability Program -not an afterthought.
2Contamination
Contamination Control
A dedicated, clean, dry storage area with built-in filtering for new oil, and every container and dispensing can correctly identified and colour-coded. .
3 Cleanliness
Cleanliness Control
An ISO 4406 target set for new oil and for oil running in key gearboxes and hydraulic systems, with contamination controlled through a regular Oil Analysis program.
4 Planning
Organization & Planning
A dedicated lubrication database or software gets the right lube to the right point, at the right time, in the right quantity — and generates the schedules itself.
5 Knowledge
Lubrication Knowledge & Application
At least one team member is technically trained on lubricants, industrial applications, managing the lubrication activity, and running Oil Analysis
6 Dispensing
Lubrication Dispensing
Fully sealed, colour-coded, clearly labelled dispensing mechanisms suited to every fill point -no open reusable cans or funnels in use.
7 RCFA
Bearing Root Cause Failure Analysis
Every bearing damage or failure is analysed for root cause - recognising that roughly 60% of bearing damage is lubrication-related.
8 Safety
Health & Safety
Material Safety Data Sheets exist for every lubricant in use and are posted in the storage areas.
BENCHMARK FRAMEWORK
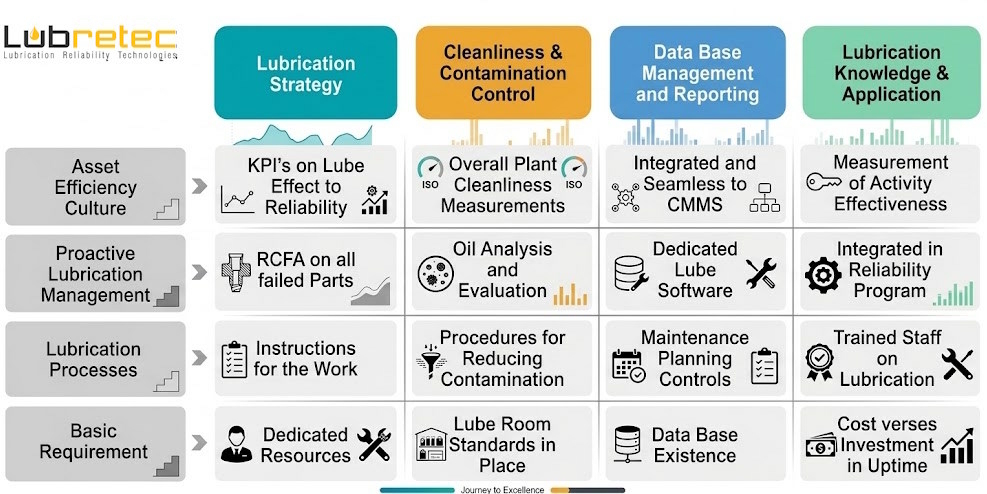
The maturity model, applied
Every plant lands on this scale. Here's what it actually looks like for one category - Cleanliness & Contamination Control - so the labels mean something concrete.

WORKED EXAMPLE
Question 2 — Contamination Control, across the scale
STANDARDS ALIGNMENT
Not built in isolation
The scoring rubric is cross-referenced against recognised reliability and lubrication standards, so your score means the same thing to an auditor as it does to your maintenance team.
ISO 4406
Lubricant cleanliness classification, used as the objective baseline for the Contamination category.
ISO 55000
Asset management principles, used to align the maturity model with your broader reliability strategy.
DELIVERABLES
What the full report contains
A preview of the structure - built from the same categories and scoring shown above.
Score by category
| 1 | Lubrication Strategy | 6 |
| 2 | Contamination Control | 3 |
| 3 | Cleanliness Control | 2 |
| 4 | Organisation & Planning | 4 |
| 5 | Knowledge & Application | 5 |
| 6 | Lubrication Dispensing | 7 |
| 7 | Bearing RCFA | 2 |
| 8 | Health & Safety | 8 |
Gap analysis, ranked by risk
- No bearing RCFA process
With ~60% of bearing damage lubrication-related, failures repeat with the root cause never identified. - No ISO 4406 targets set
Cleanliness in key gearboxes and hydraulic systems can't be measured or trended without a target. - Storage lacks built-in filtering
New oil may already be out of spec before it reaches the machine. - No dedicated lubrication database
Schedules rely on memory rather than a system that manages right lube, right point, right time.
GETTING STARTED
Two ways to begin
Start with a quick self-assessment to gauge direction, or bring us on-site for the full evidence-based benchmark. Most clients start with the first and convert to the second once the gap is confirmed.
Track 1
Quick Self-Assessment
An 8-question guided survey you complete yourself.
Gives a directional read on where you likely sit on the maturity scale.
- 15 minutes, completed online
- No site visit required
- Indicative maturity band, not a full score
- Free - results returned within 2 business days
Track 2
Full On-Site Assessment
The complete methodology above: site walk,
oil sampling, CMMS review, and interviews, scored against the weighted rubric.
- 0.5–2 days on-site, scoped to plant size
- Involves maintenance planner, lube tech, and one supervisor
- Full Lubrication Reliability Score & Gap Analysis Report
- Optional follow-up training and roadmap support
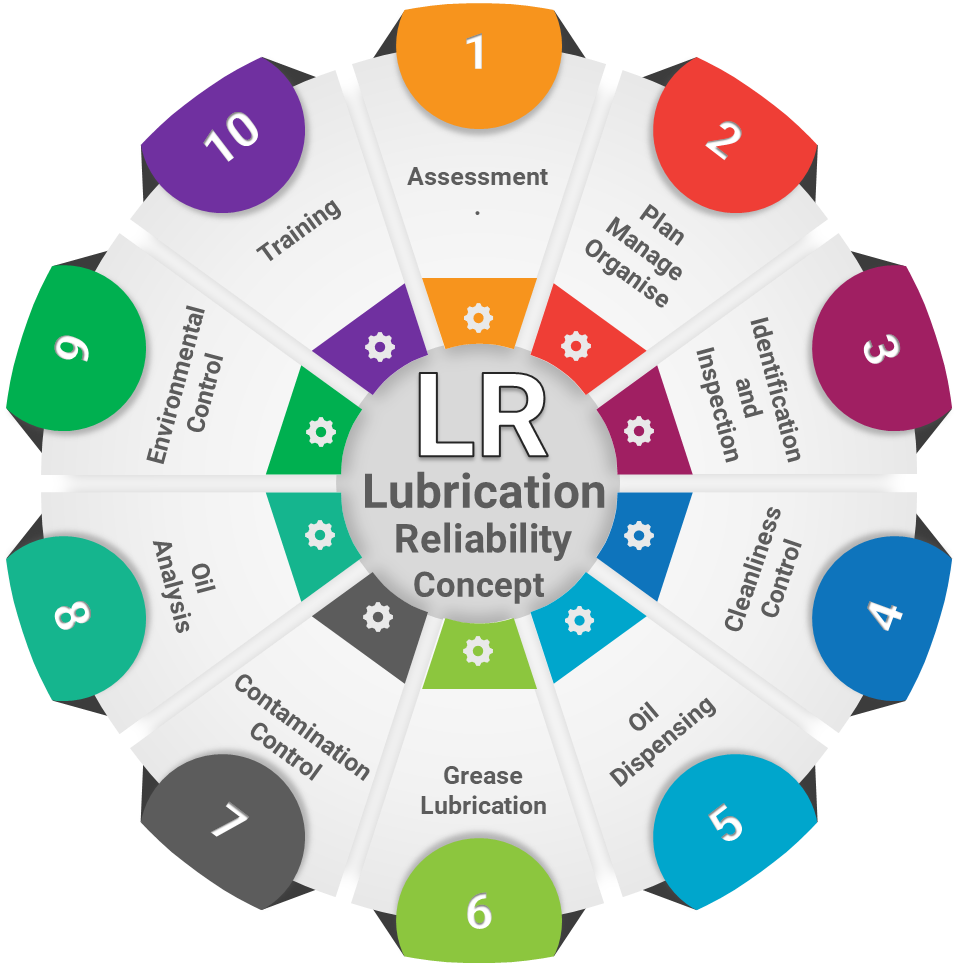
HOW THIS FITS TO LUBRICATION RELIABILITY™
1 Assess & Benchmark
② Organise & Plan
③ Identify & Inspect
④ Cleanliness Control
⑤ Dispense Precisely
⑥ Grease Effectively
⑦ Control Contamination
⑧ Condition Monitoring
⑨ Environmental Control
⑩ Knowledge Management
This is the foundation step: every other step in the Lubrication Reliability™ programme is measured against the baseline set here. Get it right, and
Step 2's planning work is organising against a real, defensible picture of where the plant actually stands; not an assumption.
Find out where you actually stand.
Start with the quick self-assessment, or go straight to the full on-site benchmark - either way, you'll have a defensible baseline within days. Choose your track.